

Kubeflow Pipelines (kfp) is a platform for building and deploying portable, scalable machine learning (ML) workflows based on Docker containers. This guide shows you how to integrate W&B with Kubeflow Pipelines so that parameters and artifacts from your pipeline components are automatically tracked in W&B. By the end, you can apply a decorator to kfp Python functional components to log inputs, outputs, and artifacts to W&B without modifying the body of each component. This feature was enabled inDocumentation Index
Fetch the complete documentation index at: https://wb-21fd5541-style-guide-models-integrations-20260527-015516.mintlify.app/llms.txt
Use this file to discover all available pages before exploring further.
wandb==0.12.11 and requires kfp<2.0.0.
Sign up and create an API key
An API key authenticates your machine to W&B. You can generate an API key from your user profile.For a more streamlined approach, create an API key by going directly to User Settings. Copy the newly created API key immediately and save it in a secure location such as a password manager.
- Click your user profile icon in the upper right corner.
- Select User Settings, then scroll to the API Keys section.
Install the wandb library and log in
To install the wandb library locally and log in:
- Command Line
- Python
- Python notebook
-
Set the
WANDB_API_KEYenvironment variable to your API key. -
Install the
wandblibrary and log in.
Decorate your components
With thewandb library installed, you can now enable W&B tracking on individual pipeline components. Add the @wandb_log decorator and create your components as usual. This automatically logs the input and output parameters and artifacts to W&B each time you run your pipeline.
Pass environment variables to containers
Each pipeline component runs in its own container, so the W&B credentials available on your local machine aren’t automatically propagated to the component. You may need to explicitly pass environment variables to your containers so that each component can authenticate to W&B. For two-way linking, you should also set the environment variablesWANDB_KUBEFLOW_URL to the base URL of your Kubeflow Pipelines instance. For example, https://kubeflow.mysite.com.
Access your data programmatically
Once your pipeline runs are logging to W&B, you can review and retrieve the tracked data in several ways. The following sections describe how to access your runs from the Kubeflow Pipelines UI, the W&B web app, and the W&B Public API.Kubeflow Pipelines UI
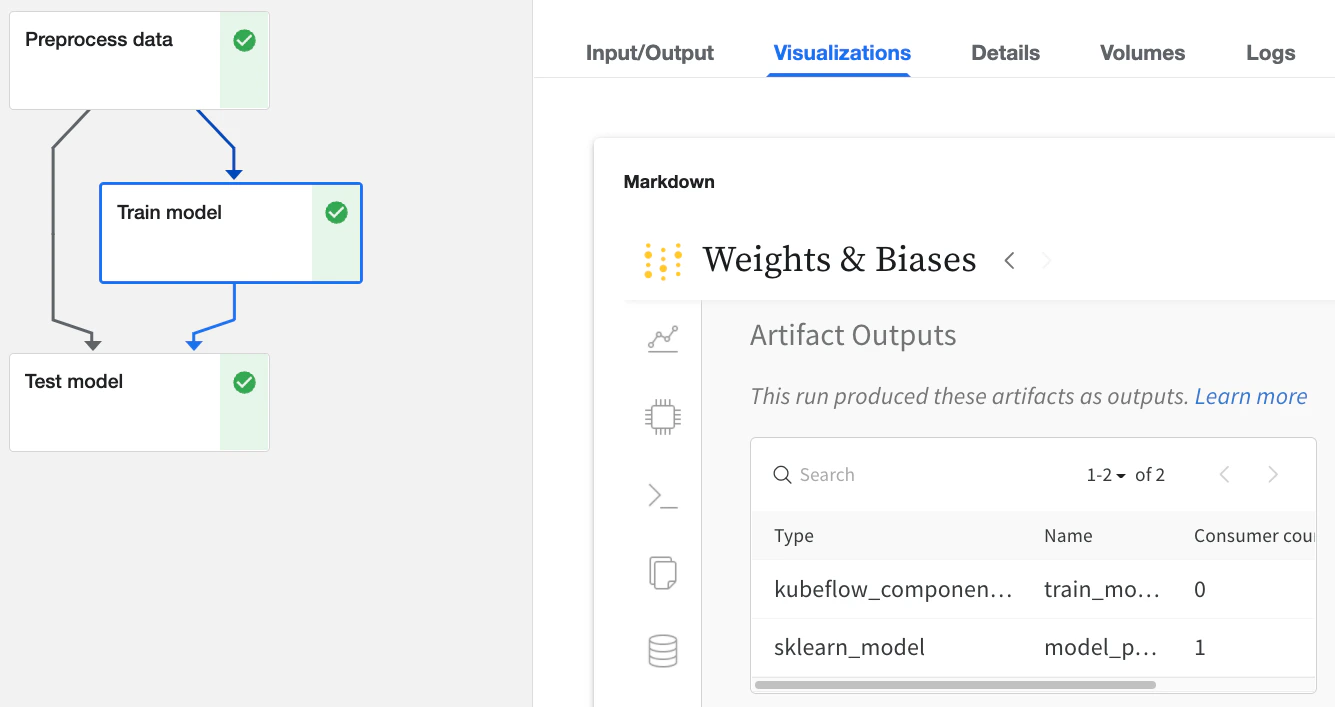
Click any run in the Kubeflow Pipelines UI that has been logged with W&B, then:- Find details about inputs and outputs in the Input/Output and ML Metadata tabs.
- View the W&B web app from the Visualizations tab.
W&B web app UI
The web app UI has the same content as the Visualizations tab in Kubeflow Pipelines, but with more space. For details, see the W&B web app documentation.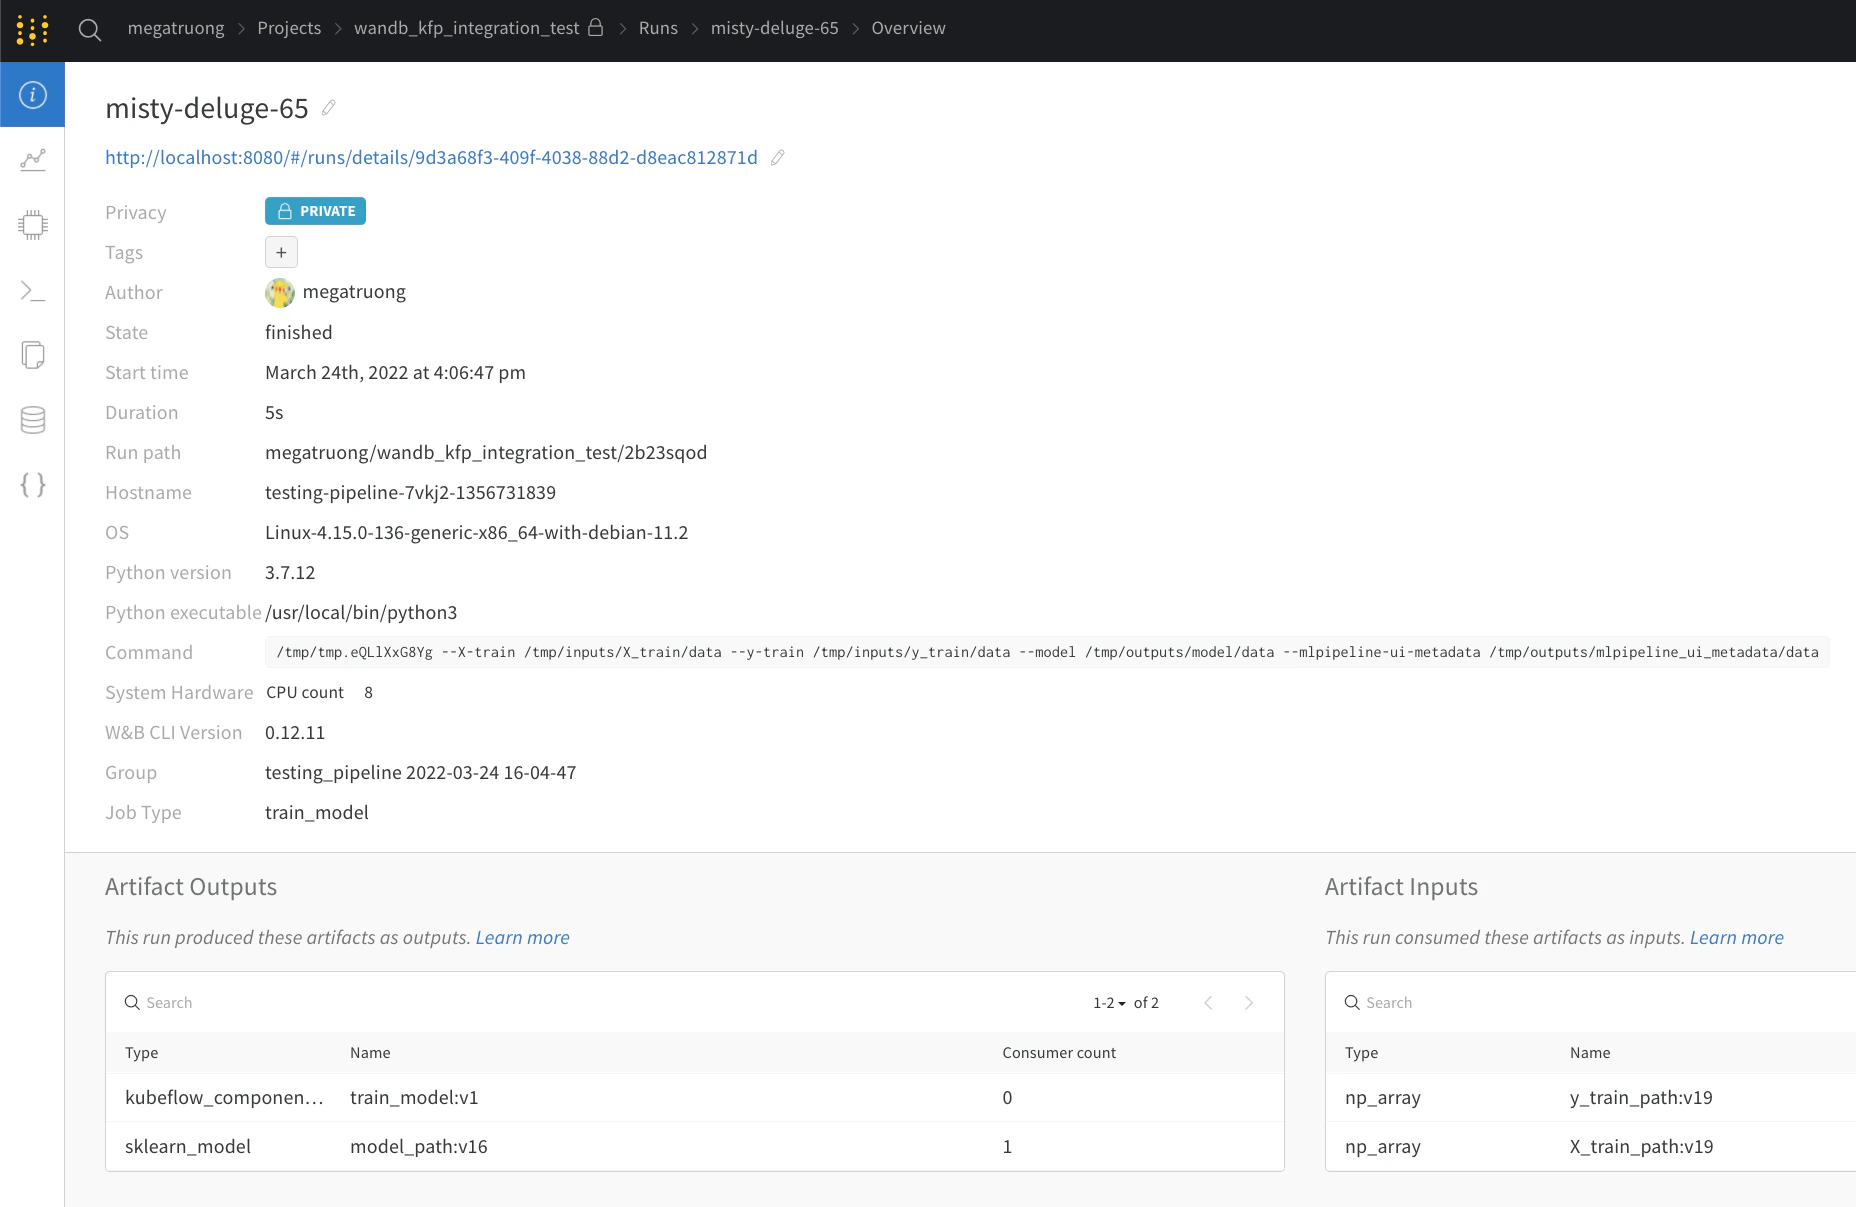
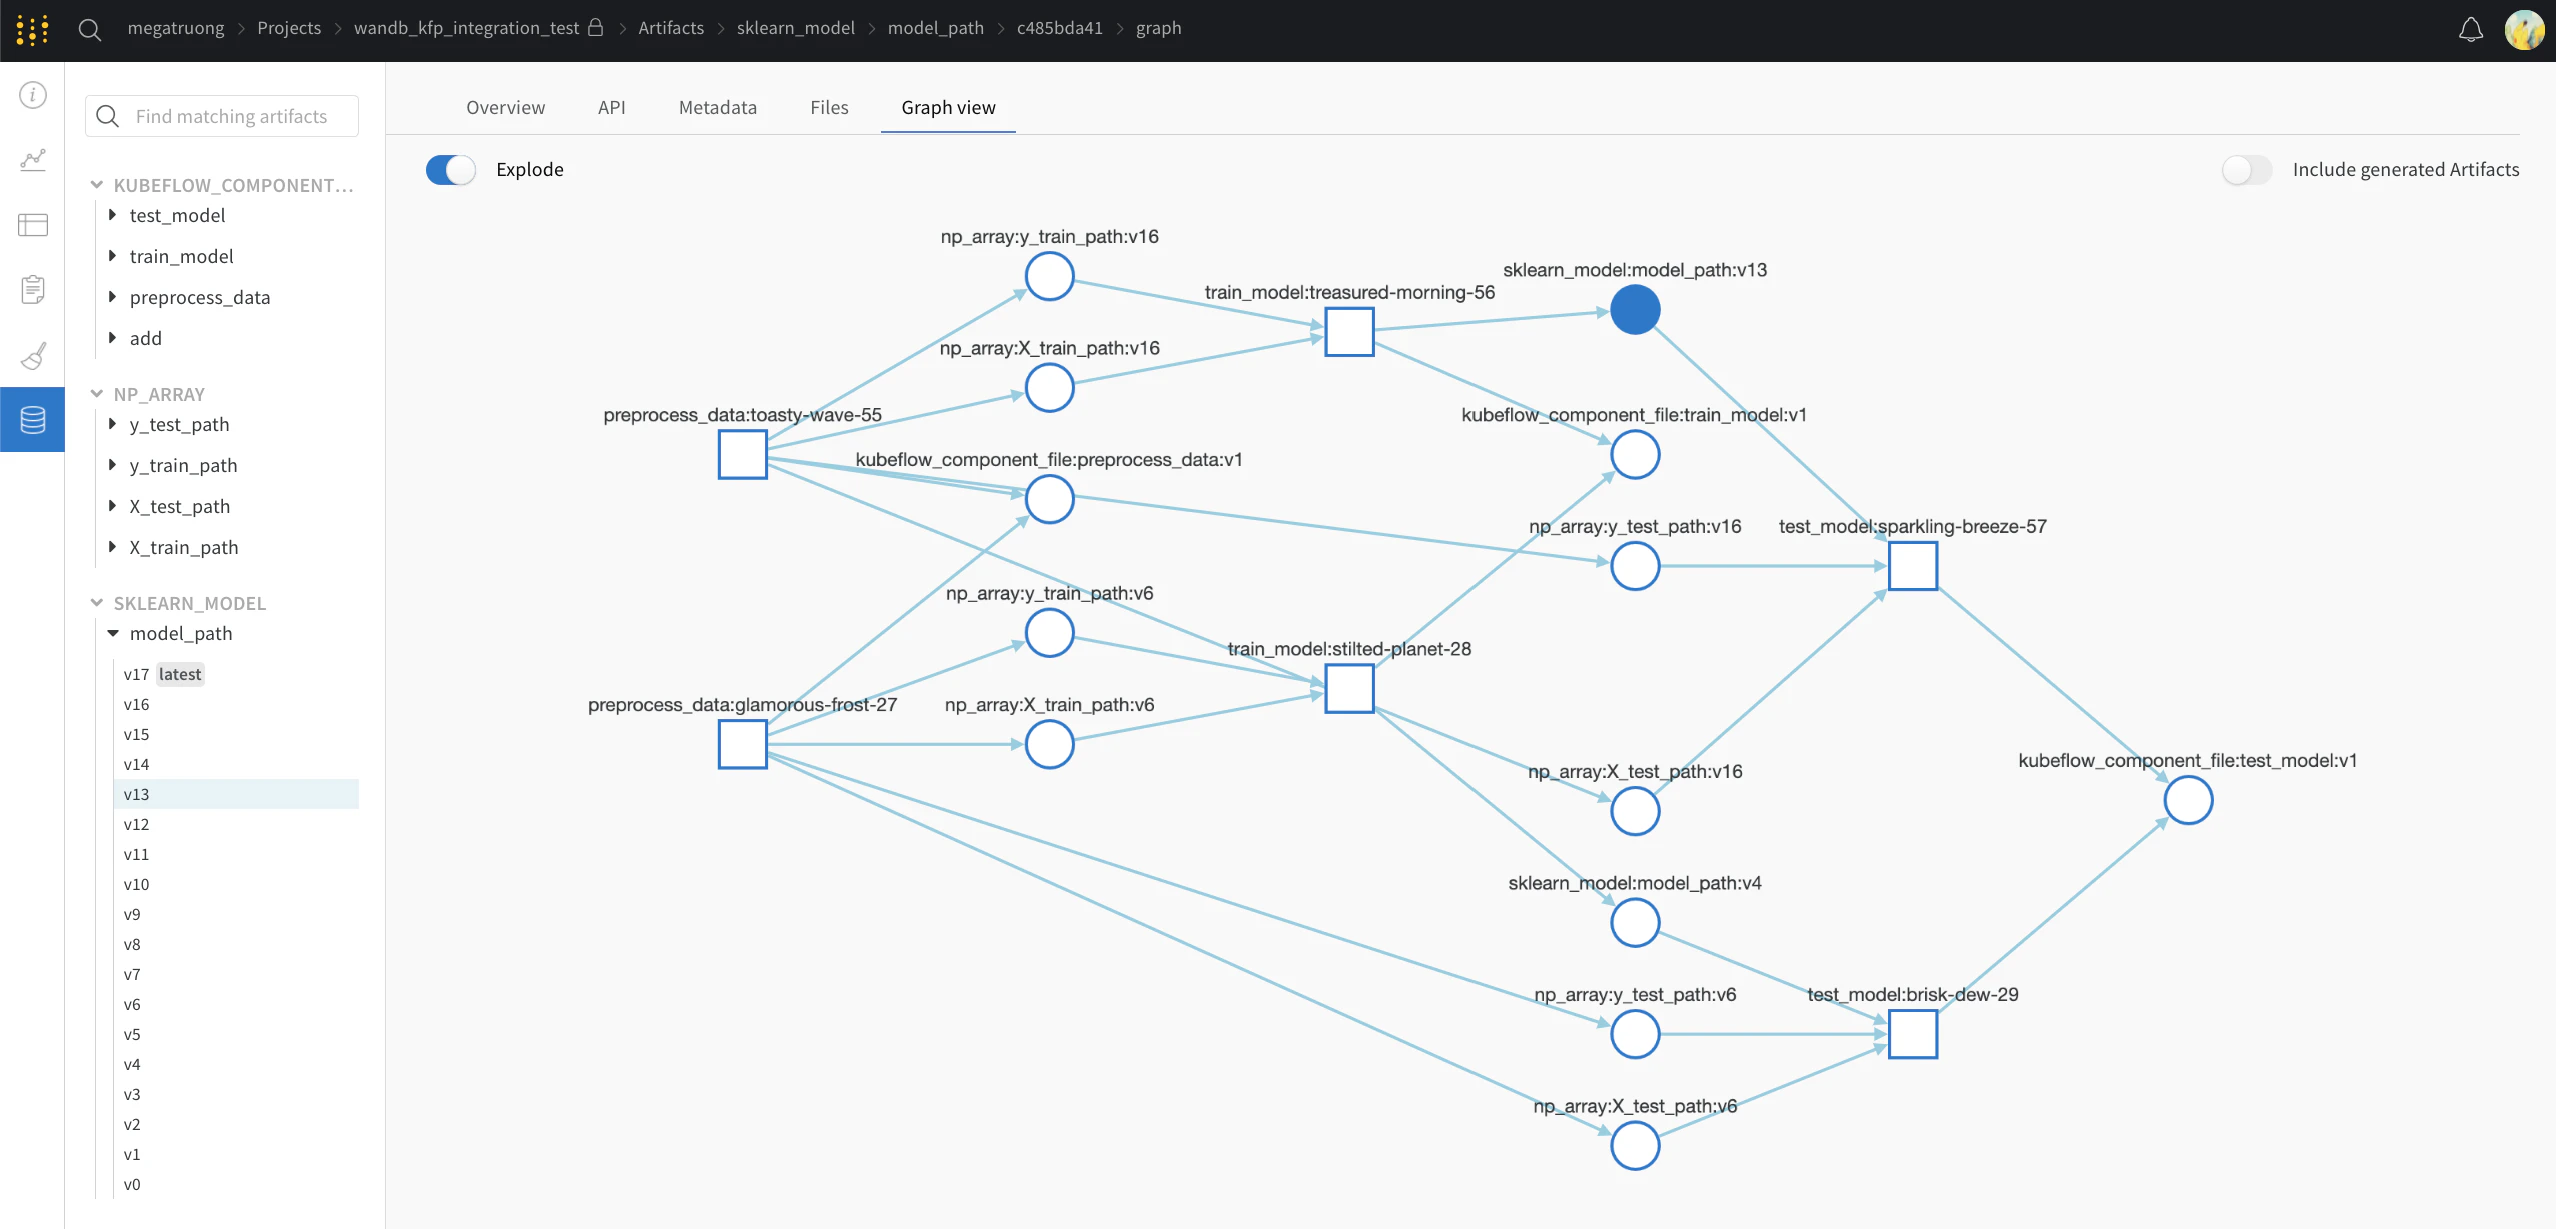
Public API
For programmatic access, see the Public API.Concept mapping from Kubeflow Pipelines to W&B
The following table maps Kubeflow Pipelines concepts to W&B.| Kubeflow Pipelines | W&B | Location in W&B |
|---|---|---|
| Input Scalar | config | Overview tab |
| Output Scalar | summary | Overview tab |
| Input Artifact | Input Artifact | Artifacts tab |
| Output Artifact | Output Artifact | Artifacts tab |
Fine-grain logging
The@wandb_log decorator handles inputs and outputs automatically, but it doesn’t capture intermediate values such as training metrics across epochs. If you want finer control of logging, you can add wandb.log() and wandb.log_artifact() calls in the component.
With explicit wandb.log_artifact() calls
In the following example, you train a model. The @wandb_log decorator automatically tracks the relevant inputs and outputs. If you want to log the training process, you can explicitly add that logging like so: