

Prodigy is an annotation tool for creating training and evaluation data for machine learning models, error analysis, and data inspection and cleaning. W&B Tables let you log, visualize, analyze, and share datasets (and more) inside W&B. This guide shows you how to use the W&B integration with Prodigy to upload your Prodigy-annotated dataset directly to W&B so you can explore and share it as an interactive Table. Use this when you want to inspect annotation quality, compare versions of a labeled dataset, or share results with collaborators. With a few lines of code, like these:Documentation Index
Fetch the complete documentation index at: https://wb-21fd5541-style-guide-models-integrations-20260527-015516.mintlify.app/llms.txt
Use this file to discover all available pages before exploring further.
Quickstart
Usewandb.integration.prodigy.upload_dataset to upload your annotated Prodigy dataset directly from the local Prodigy database to W&B in the Table format. For more information about Prodigy, including installation and setup, see the Prodigy documentation.
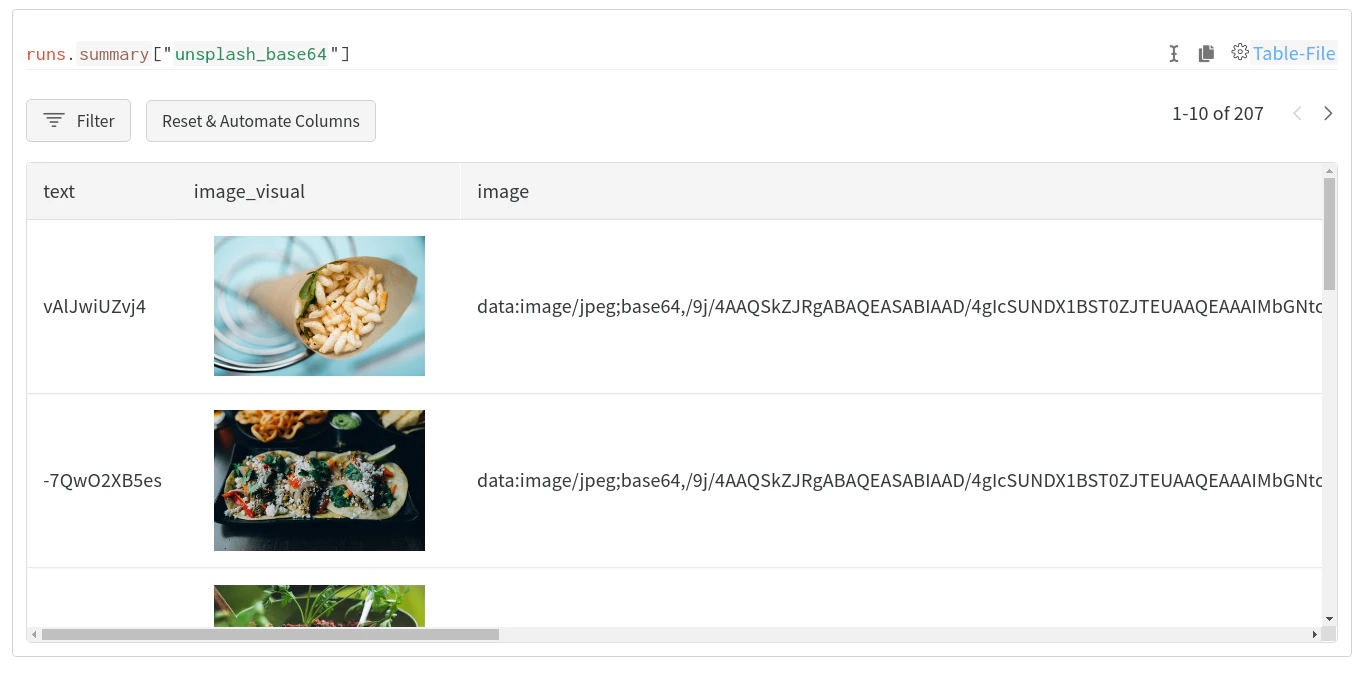
When you upload a dataset, W&B automatically converts images and named entity fields to wandb.Image and wandb.Html respectively, so they render as interactive visualizations in your Table. W&B may add extra columns to the resulting table to include these visualizations.