

This page shows scikit-learn users how to use W&B to track experiments and automatically log charts that visualize and compare model performance. You can use wandb to visualize and compare your scikit-learn models’ performance with a few lines of code. Try an example.Documentation Index
Fetch the complete documentation index at: https://wb-21fd5541-style-guide-models-integrations-20260527-015516.mintlify.app/llms.txt
Use this file to discover all available pages before exploring further.
Get started
Sign up and create an API key
An API key authenticates your machine to W&B. You can generate an API key from your user profile.For a more streamlined approach, create an API key by going directly to User Settings. Copy the newly created API key immediately and save it in a secure location such as a password manager.
- Click your user profile icon in the upper right corner.
- Select User Settings, then scroll to the API Keys section.
Install the wandb library and log in
To install the wandb library locally and log in:
- Command Line
- Python
- Python notebook
-
Set the
WANDB_API_KEYenvironment variable to your API key. -
Install the
wandblibrary and log in.
Log metrics
After installing and logging in, log metrics from your scikit-learn training code so you can compare runs in W&B.Make plots
In addition to logging metrics, you can generate diagnostic plots for your scikit-learn models and log them as part of a run. The following steps initialize a run and then visualize either individual plots or a full set of plots for a given model type.Import wandb and initialize a new run
Visualize plots
The following sections describe how to visualize individual plots or all plots for a given model type.Individual plots
After training a model and making predictions, you can generate plots in wandb to analyze your predictions. For more information about supported charts, see the Supported plots section.All plots
W&B has functions such asplot_classifier that plot several relevant plots:
Existing Matplotlib plots
If you already create plots with Matplotlib, you can log them on the W&B dashboard alongside your scikit-learn plots. To do that, you must first installplotly.
Supported plots
The following sections describe each plot type thatwandb.sklearn can produce, along with the function signature and arguments. Use these as a reference when calling individual plot functions or interpreting the output of plot_classifier, plot_regressor, and plot_clusterer.
Learning curve
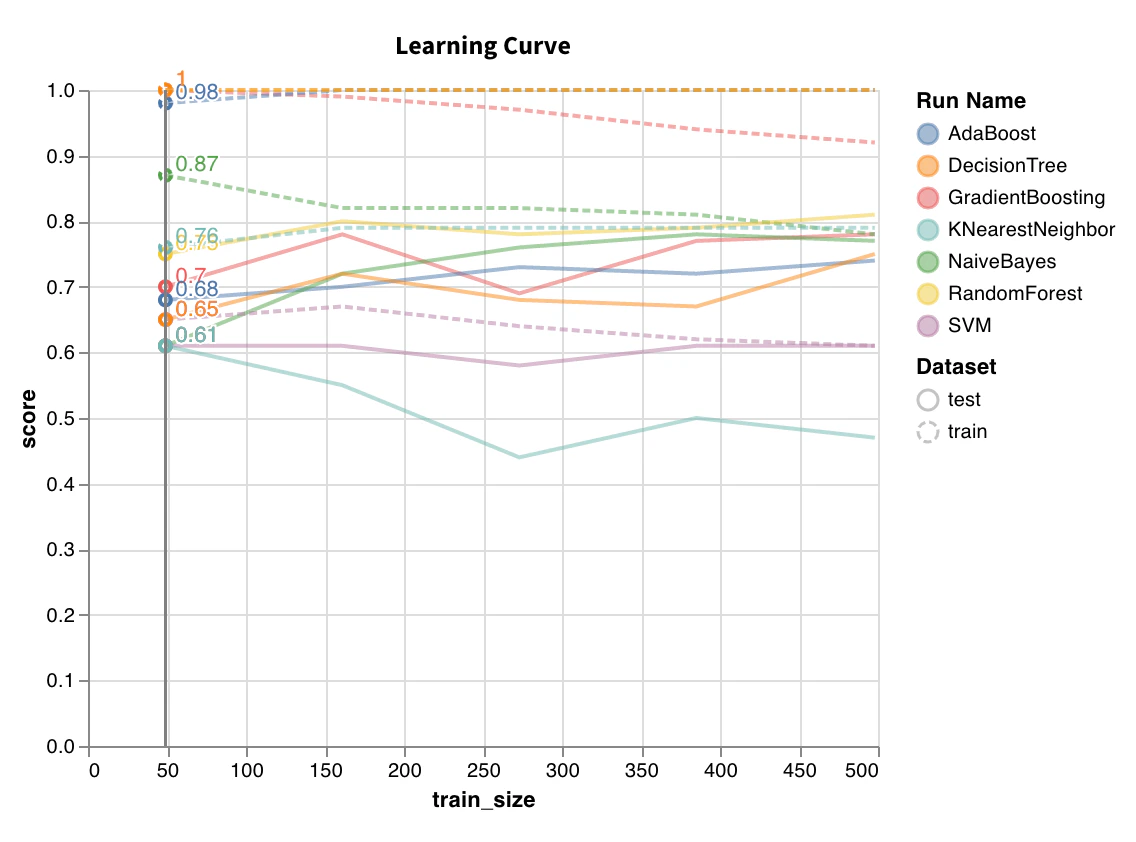
wandb.sklearn.plot_learning_curve(model, X, y)
- model (clf or reg): Takes in a fitted regressor or classifier.
- X (arr): Dataset features.
- y (arr): Dataset labels.
ROC
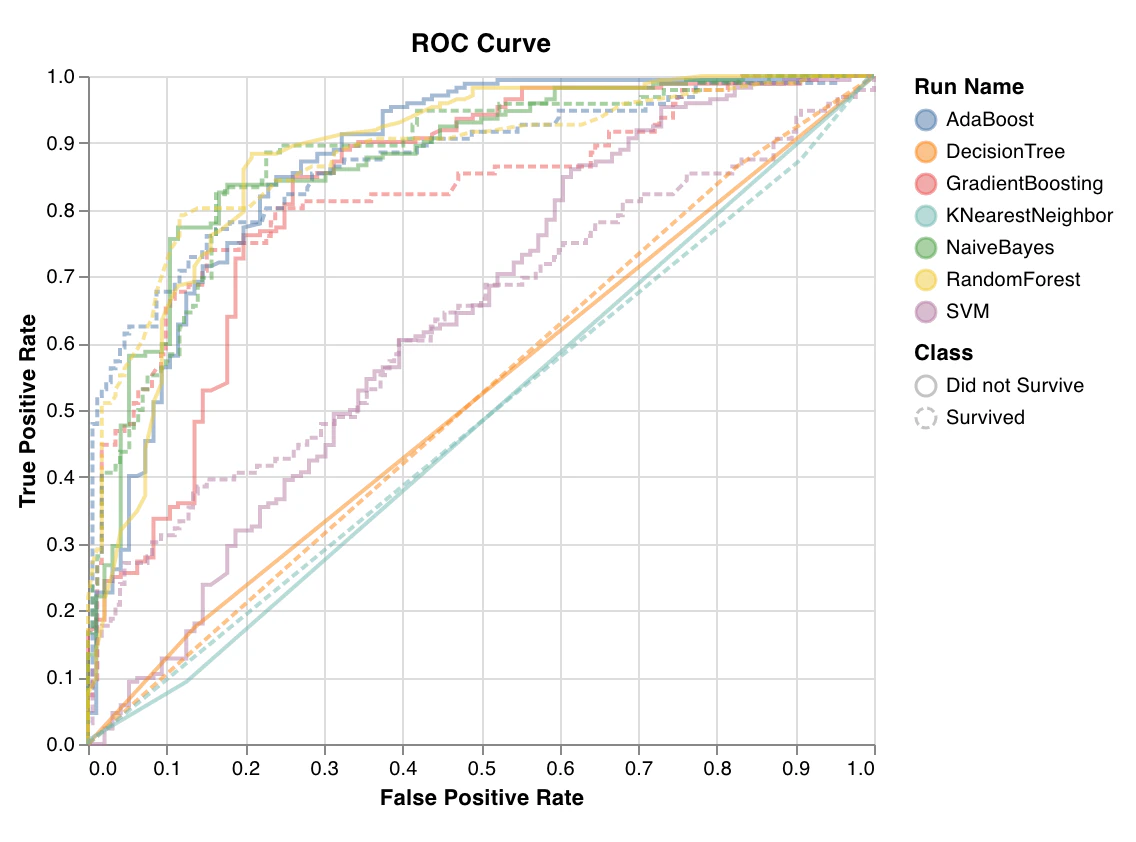
wandb.sklearn.plot_roc(y_true, y_probas, labels)
- y_true (arr): Test set labels.
- y_probas (arr): Test set predicted probabilities.
- labels (list): Named labels for target variable (y).
Class proportions
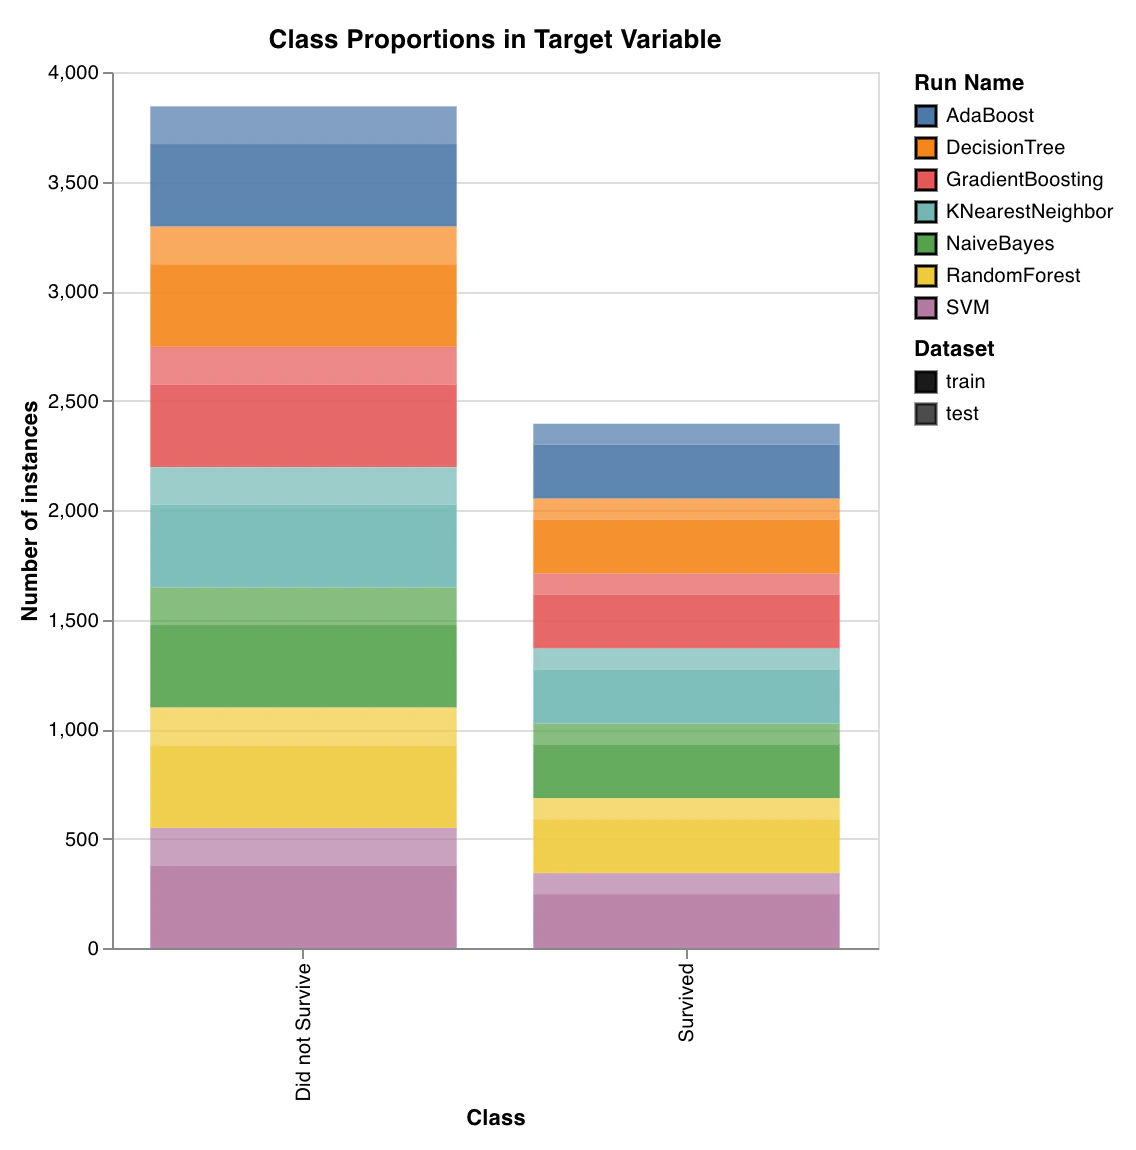
wandb.sklearn.plot_class_proportions(y_train, y_test, ['dog', 'cat', 'owl'])
- y_train (arr): Training set labels.
- y_test (arr): Test set labels.
- labels (list): Named labels for target variable (y).
Precision recall curve
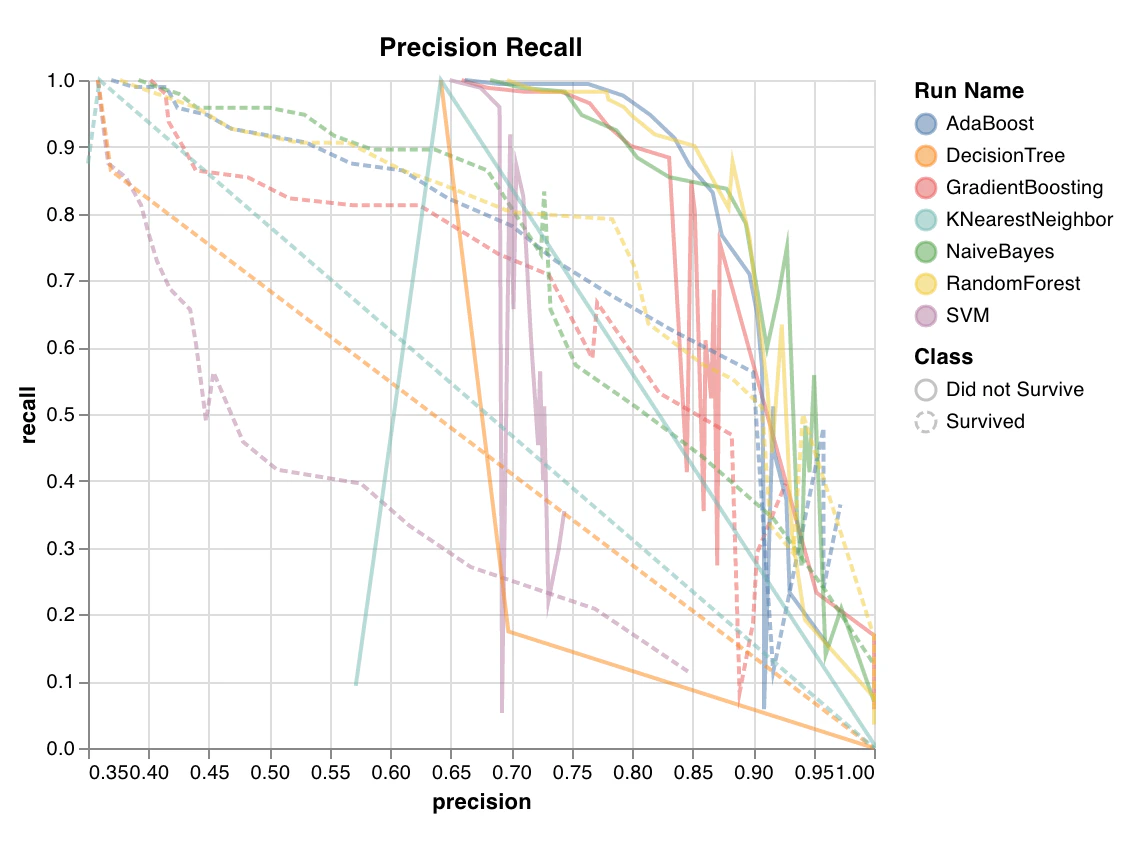
wandb.sklearn.plot_precision_recall(y_true, y_probas, labels)
- y_true (arr): Test set labels.
- y_probas (arr): Test set predicted probabilities.
- labels (list): Named labels for target variable (y).
Feature importances
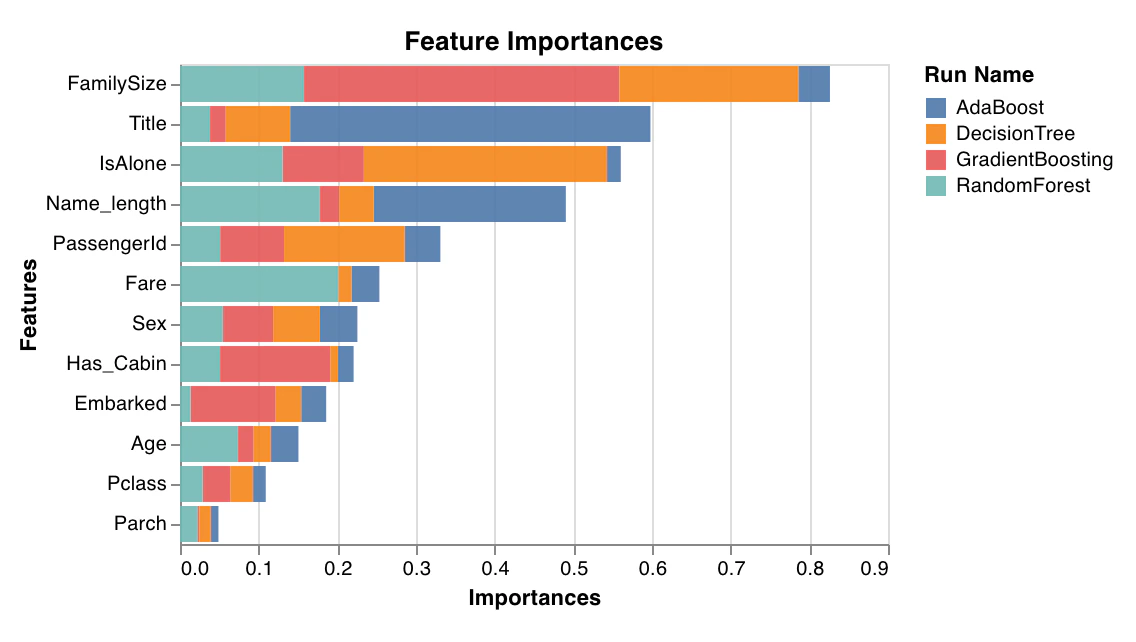
feature_importances_ attribute, such as trees.
wandb.sklearn.plot_feature_importances(model, ['width', 'height, 'length'])
- model (clf): Takes in a fitted classifier.
- feature_names (list): Names for features. Makes plots easier to read by replacing feature indexes with corresponding names.
Calibration curve
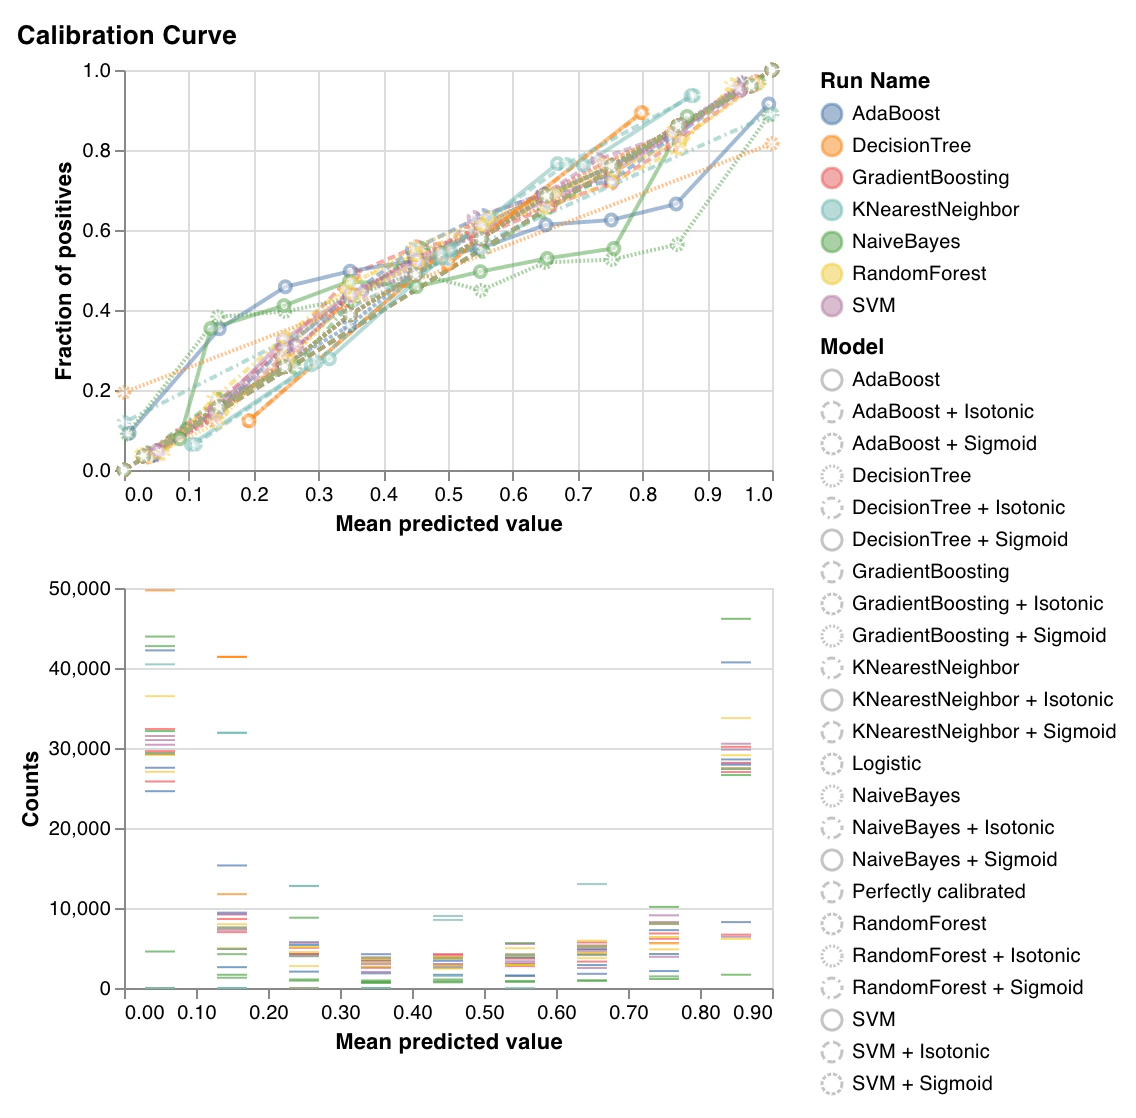
wandb.sklearn.plot_calibration_curve(clf, X, y, 'RandomForestClassifier')
- model (clf): Takes in a fitted classifier.
- X (arr): Training set features.
- y (arr): Training set labels.
- model_name (str): Model name. Defaults to
"Classifier".
Confusion matrix
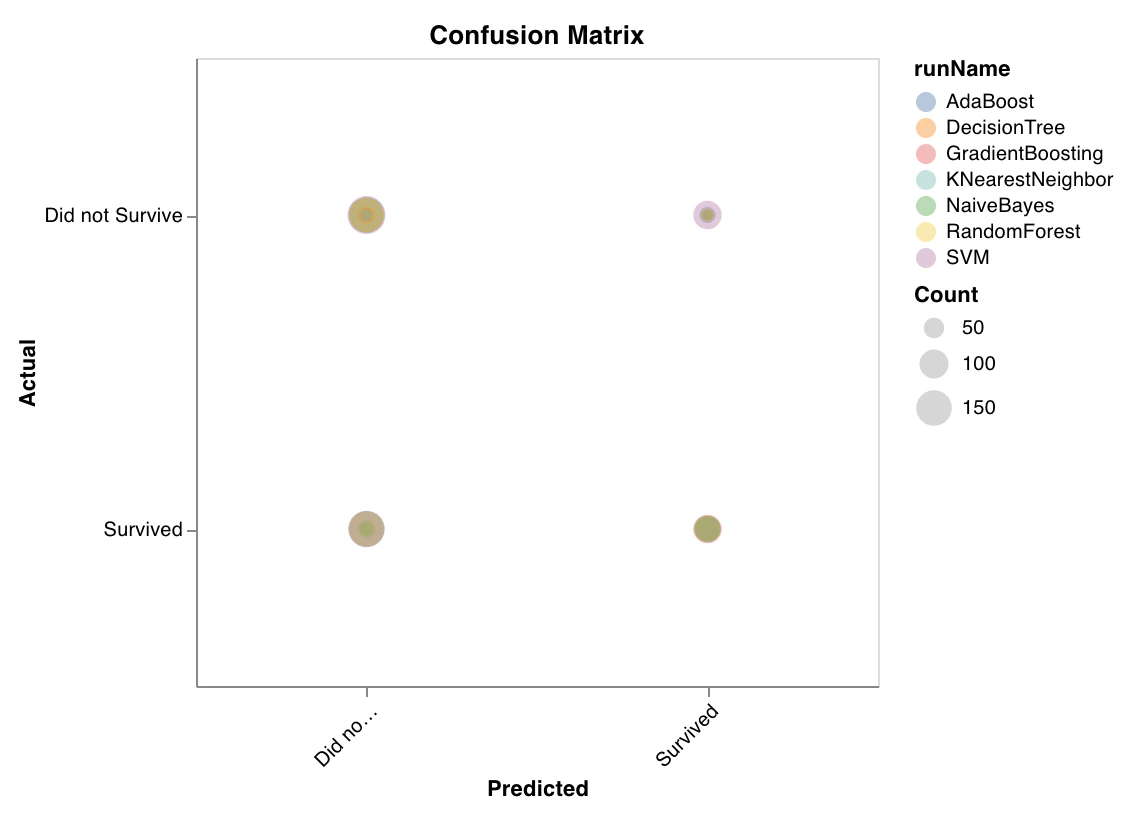
wandb.sklearn.plot_confusion_matrix(y_true, y_pred, labels)
- y_true (arr): Test set labels.
- y_pred (arr): Test set predicted labels.
- labels (list): Named labels for target variable (y).
Summary metrics
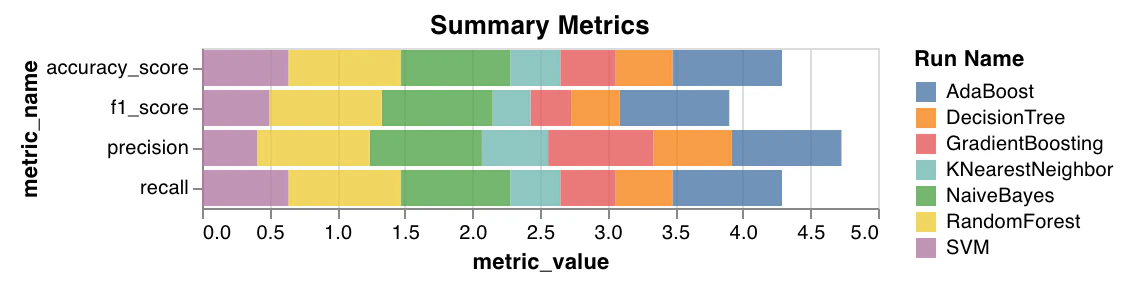
- Calculates summary metrics for classification, such as
mse,mae, andr2score. - Calculates summary metrics for regression, such as
f1, accuracy, precision, and recall.
wandb.sklearn.plot_summary_metrics(model, X_train, y_train, X_test, y_test)
- model (clf or reg): Takes in a fitted regressor or classifier.
- X (arr): Training set features.
- y (arr): Training set labels.
- X_test (arr): Test set features.
- y_test (arr): Test set labels.
Elbow plot
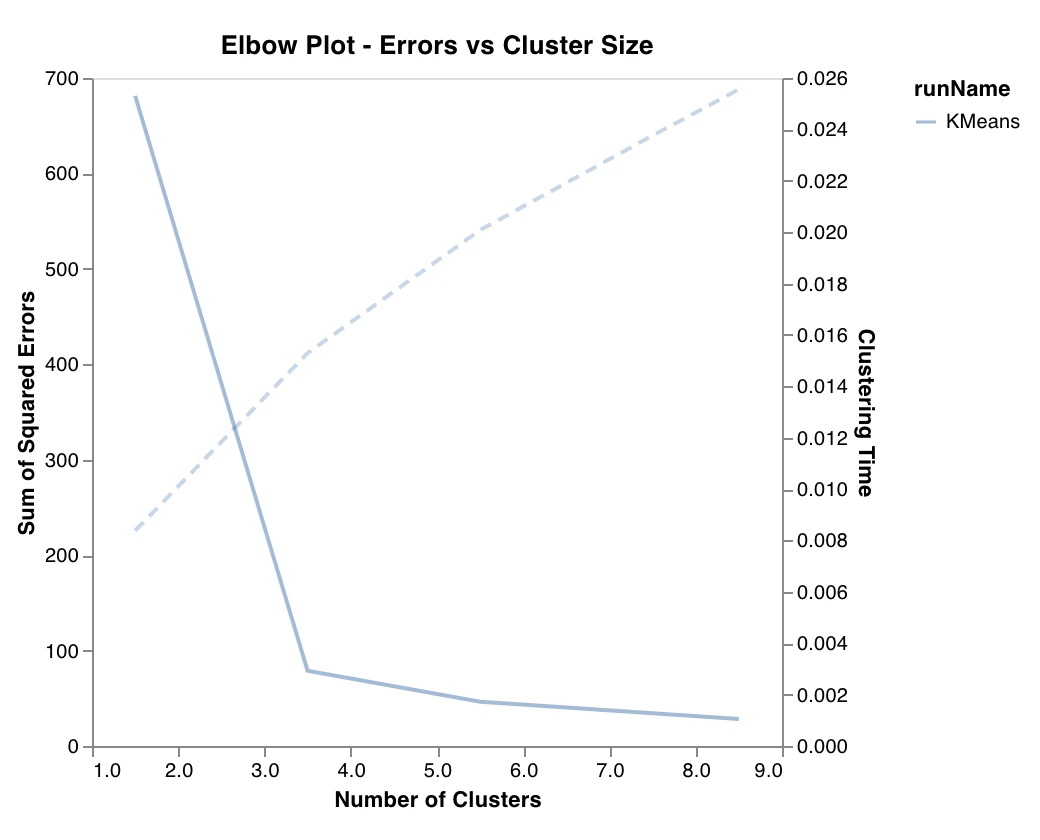
wandb.sklearn.plot_elbow_curve(model, X_train)
- model (clusterer): Takes in a fitted clusterer.
- X (arr): Training set features.
Silhouette plot
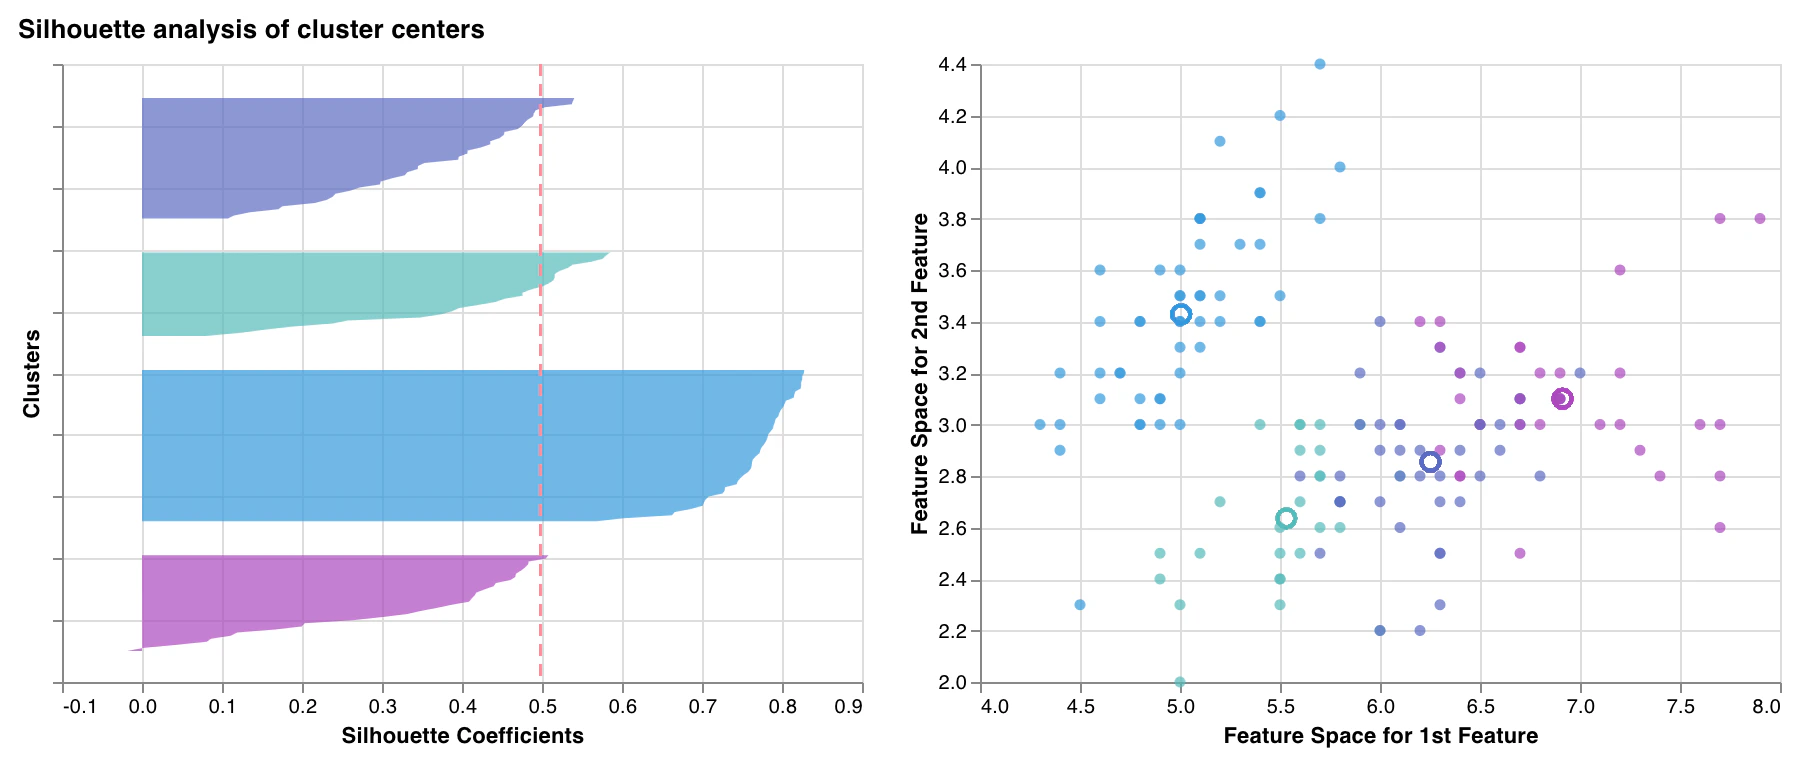
wandb.sklearn.plot_silhouette(model, X_train, ['spam', 'not spam'])
- model (clusterer): Takes in a fitted clusterer.
- X (arr): Training set features.
- cluster_labels (list): Names for cluster labels. Makes plots easier to read by replacing cluster indexes with corresponding names.
Outlier candidates plot
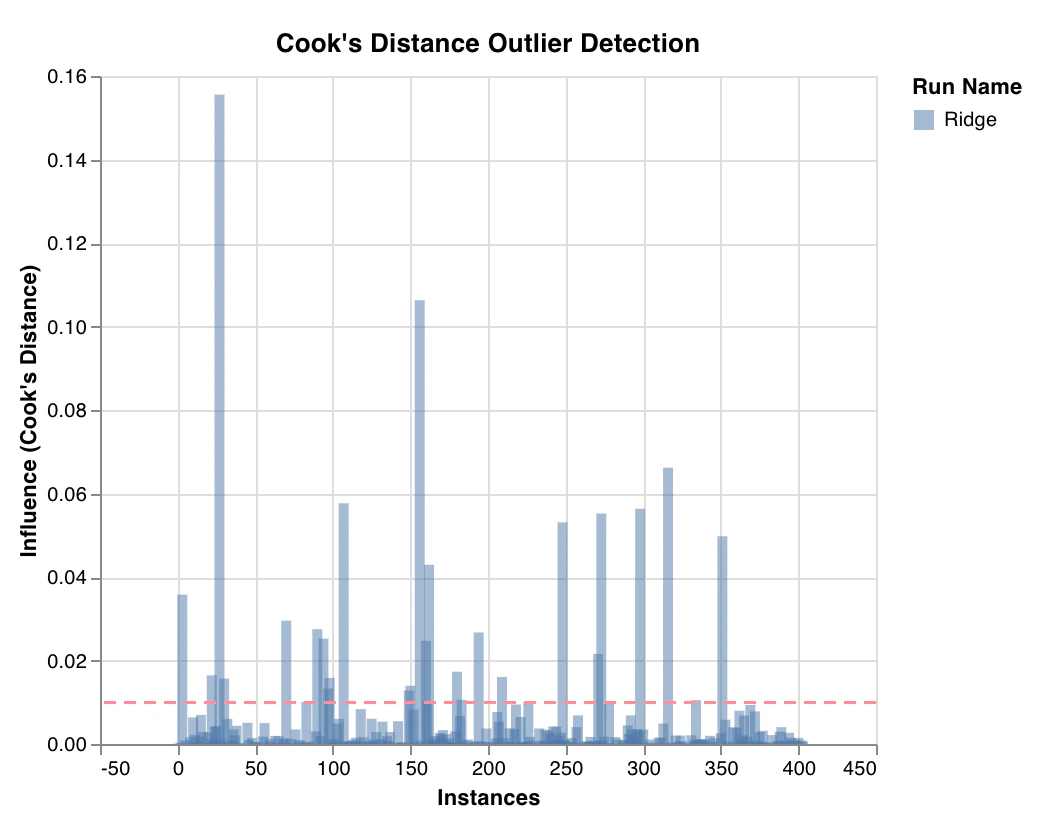
wandb.sklearn.plot_outlier_candidates(model, X, y)
- model (regressor): Takes in a fitted classifier.
- X (arr): Training set features.
- y (arr): Training set labels.
Residuals plot
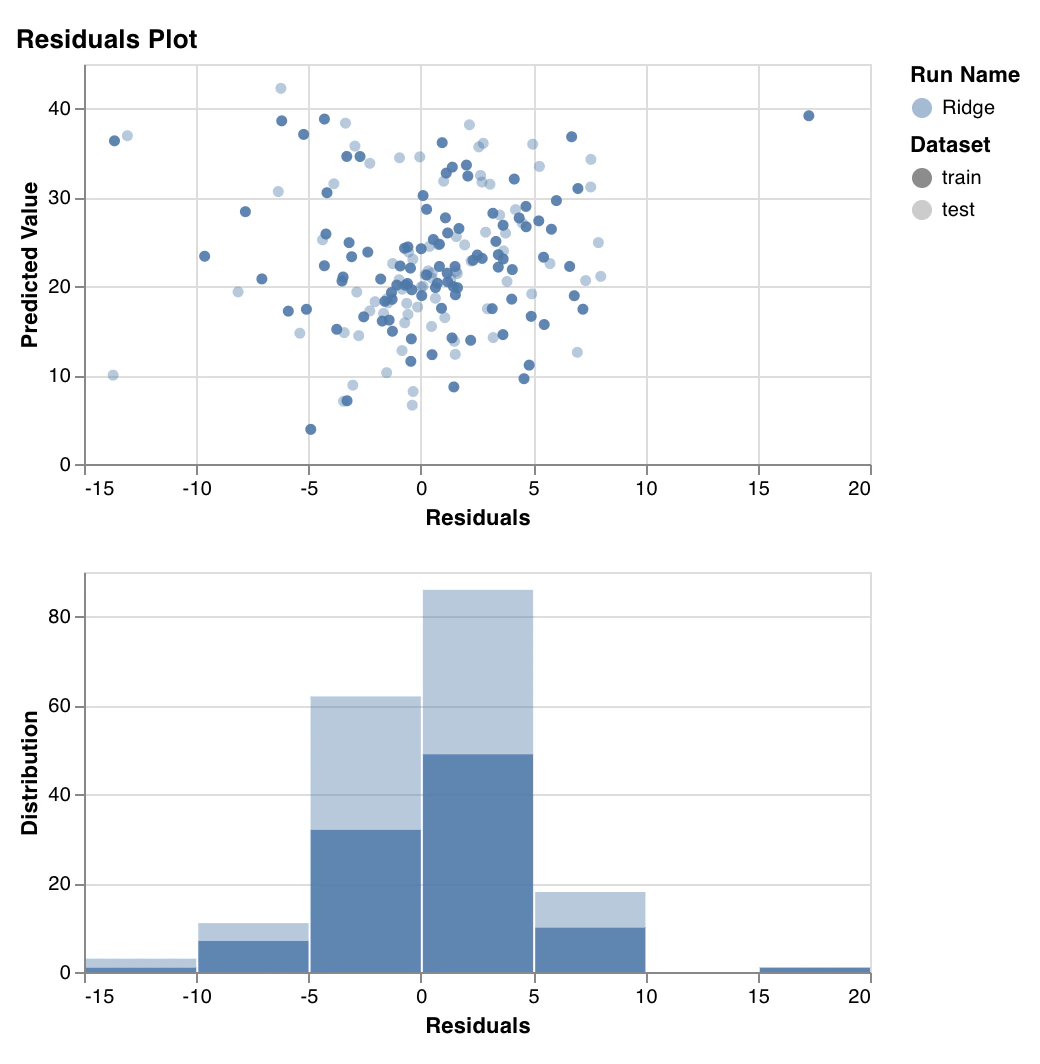
wandb.sklearn.plot_residuals(model, X, y)
- model (regressor): Takes in a fitted classifier.
- X (arr): Training set features.
- y (arr): Training set labels.