

This tutorial shows you how to use the W&B integration with Hugging Face Transformers to automatically track training and evaluation metrics, hyperparameters, and system stats while fine-tuning a model. By following this tutorial, you learn how to visualize your model’s performance through the W&B dashboard so you can compare experiments and iterate on your models with confidence. You can compare hyperparameters, output metrics, and system stats like GPU utilization across your models.Documentation Index
Fetch the complete documentation index at: https://wb-21fd5541-style-guide-models-integrations-20260527-015516.mintlify.app/llms.txt
Use this file to discover all available pages before exploring further.
Why use W&B

- Unified dashboard: Central repository for all your model metrics and predictions.
- Lightweight: No code changes required to integrate with Hugging Face.
- Accessible: Free for individuals and academic teams.
- Secure: All projects are private by default.
- Trusted: Used by machine learning teams at OpenAI, Toyota, Lyft, and more.
Install, import, and log in
This section sets up the environment you need to run the tutorial. Install the Hugging Face and W&B libraries, and download the GLUE dataset and training script for this tutorial:- Hugging Face Transformers: Natural language models and datasets.
- W&B: Experiment tracking and visualization.
- GLUE dataset: A language understanding benchmark dataset.
- GLUE script: Model training script for sequence classification.
Add your API key
Authenticating with your API key links this notebook to your W&B account so that runs are logged to your projects. After you sign up, run the next cell and click the link to get your API key and authenticate this notebook.WANDB_WATCH=all. See the Hugging Face integration guide for the full list of options.
Train the model
With the environment configured and authentication complete, you’re ready to start a training run. Call the downloaded training scriptrun_glue.py and see training automatically get tracked to the W&B dashboard. This script fine-tunes BERT on the Microsoft Research Paraphrase Corpus (pairs of sentences with human annotations indicating whether they’re semantically equivalent).
Visualize results in the dashboard
After training starts, you can monitor metrics in real time. Click the link printed out by the preceding cell, or go to wandb.ai to see your results stream in live. The link to see your run in the browser appears after all the dependencies are loaded. Look for the following output: “wandb: View run at [URL to your unique run]“Visualize model performance
Look across experiments, zoom in on findings, and visualize high-dimensional data.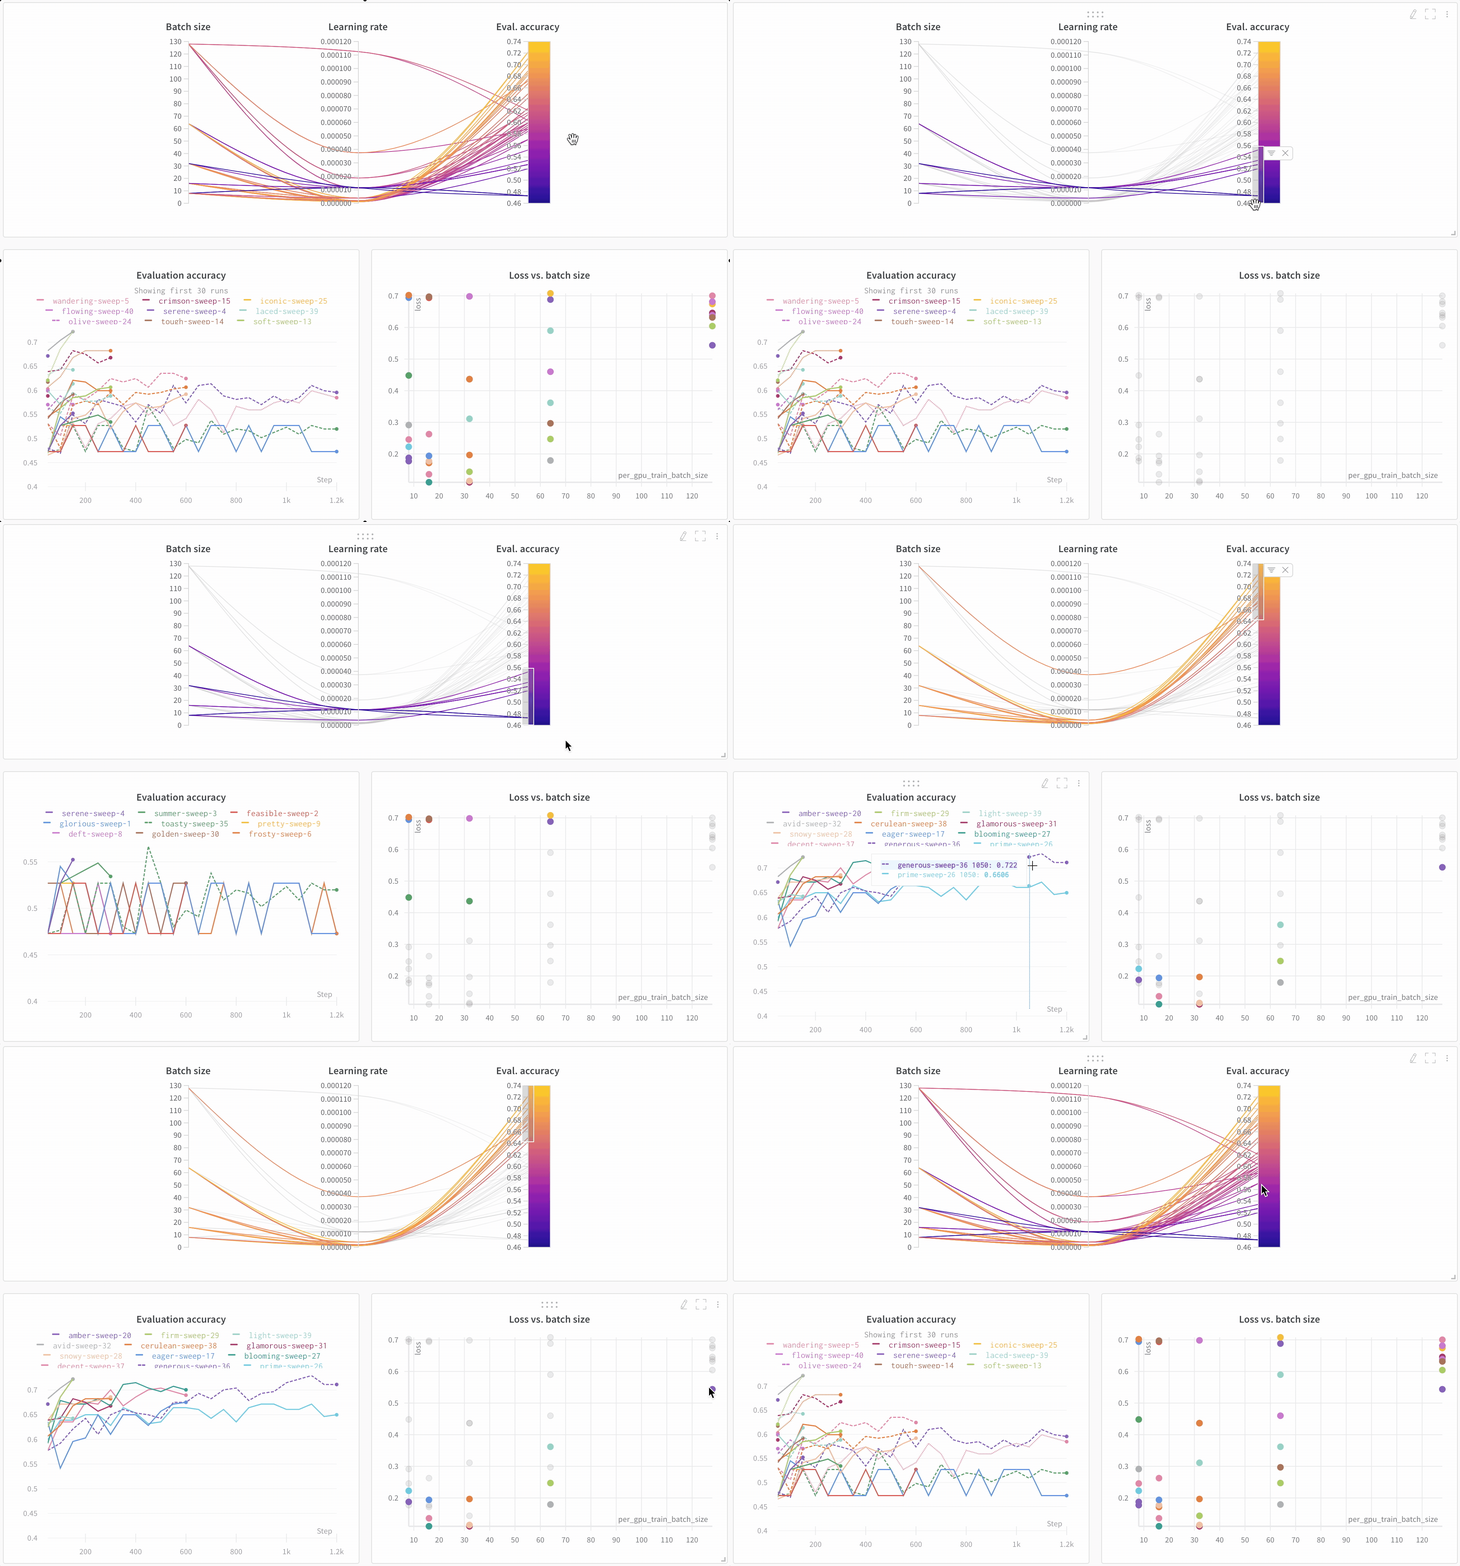
Compare architectures
Here’s an example comparing BERT versus DistilBERT. The automatic line plot visualizations show how different architectures affect the evaluation accuracy throughout training.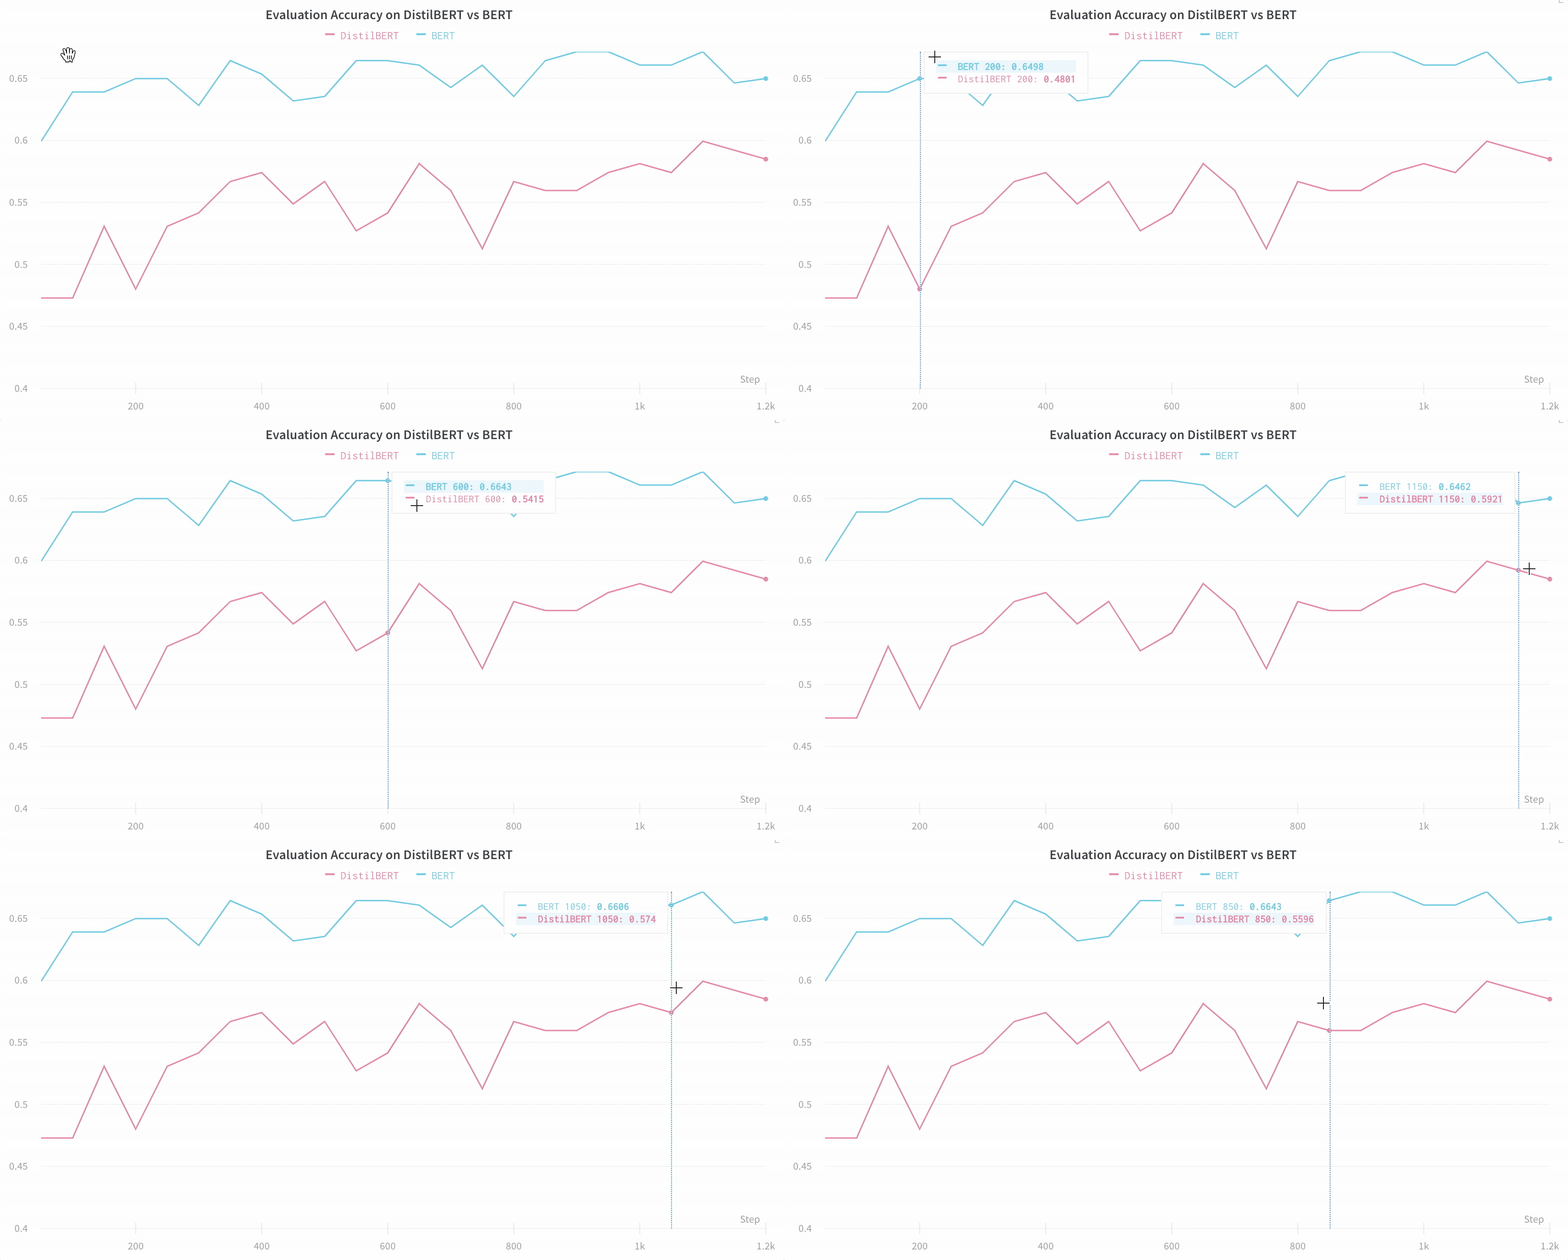
Track key information by default
This section describes what W&B captures automatically so you know what data is available in your dashboard without additional configuration. W&B saves a new run for each experiment. Here’s the information saved by default:- Hyperparameters: Settings for your model are saved in Config.
- Model metrics: Time series data of metrics streaming in are saved in Log.
- Terminal logs: Command line outputs are saved and available in a tab.
- System metrics: GPU and CPU utilization, memory, and temperature.